Forecasting Demand
4 keys to managing your new business’s inventory – Accurate sales forecasting is crucial for a new business’s success. It allows for efficient inventory management, preventing both costly shortages and excessive surplus. For a new bakery, anticipating demand requires considering seasonal fluctuations, promotional periods, and local market trends. A simple forecasting model, combining historical data (if available) with informed estimations, can provide a valuable starting point.
Forecasting Model for a New Bakery
This example uses a simple moving average model combined with seasonal adjustments and promotional considerations. While a more complex model could be implemented with more data, this provides a practical approach for a new business.
| Month | Product | Projected Units | Notes |
|---|---|---|---|
| July | Blueberry Muffins | 500 | Increased demand expected due to summer promotions |
| July | Chocolate Croissants | 700 | Steady demand throughout the year |
| August | Blueberry Muffins | 400 | Slight decrease expected after summer promotion |
| August | Apple Pies | 600 | Seasonal increase in apple pie demand |
| September | Chocolate Croissants | 650 | Moderate demand; back-to-school season |
| September | Pumpkin Bread | 800 | High demand expected due to autumn season and potential promotions |
The Importance of Accurate Sales Forecasting
Accurate sales forecasting minimizes inventory-related risks. Underestimating demand leads to stockouts, lost sales, and dissatisfied customers. Overestimating demand results in excess inventory, leading to spoilage, obsolescence, and increased storage costs. A balanced approach, achieved through meticulous forecasting, optimizes profitability.
Comparing Forecasting Methods
For a new business with limited historical data, two suitable methods are qualitative forecasting (expert opinion) and simple moving average. Qualitative forecasting relies on the expertise of experienced bakers or market research to estimate demand. The simple moving average utilizes recent sales data (if available) to predict future demand. While qualitative methods offer insights when historical data is scarce, the simple moving average provides a quantitative baseline, which can be refined as more data becomes available.
Combining both methods can offer a more robust prediction.
Optimizing Inventory Levels
Maintaining optimal inventory levels is a balancing act between meeting customer demand and minimizing holding costs. The Economic Order Quantity (EOQ) model provides a framework for calculating the ideal order size to minimize these costs.
Calculating Optimal Inventory Levels using EOQ
The EOQ model considers factors such as demand, ordering costs, and holding costs to determine the most cost-effective order quantity. The formula is: EOQ = √[(2*D*O)/H] where D = annual demand, O = ordering cost per order, and H = holding cost per unit per year.
Example: A bakery with an annual demand (D) of 10,000 loaves of bread, an ordering cost (O) of $50 per order, and a holding cost (H) of $2 per loaf per year would have an EOQ of √[(2
– 10000
– 50) / 2] = 707 loaves. This means the bakery should order approximately 707 loaves at a time to minimize total inventory costs.
Risks of Excessive Inventory
Holding excessive inventory exposes businesses to several risks. Perishable goods like baked goods can spoil, leading to significant losses. Products can become obsolete due to changing consumer preferences or technological advancements. Storage costs, including rent, utilities, and insurance, can significantly impact profitability. Furthermore, capital tied up in excess inventory could be used for other business opportunities.
Minimizing Inventory Holding Costs

Source: forceintellect.com
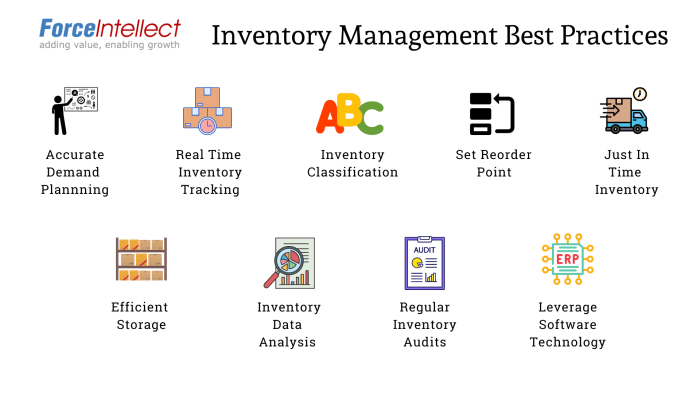
Strategies for minimizing inventory holding costs include implementing just-in-time (JIT) inventory management for perishable items, negotiating better storage terms, and accurately forecasting demand to reduce overstocking. For non-perishable items, strategies include bulk purchasing with discounts, effective storage solutions, and regular inventory reviews to identify slow-moving items.
Implementing an Inventory Management System: 4 Keys To Managing Your New Business’s Inventory
Implementing an inventory management system streamlines operations and enhances accuracy. Choosing the right software and effectively deploying it are key to realizing its benefits.
Comparison of Inventory Management Software, 4 keys to managing your new business’s inventory
| Software Name | Key Features | Pricing | Best Suited For |
|---|---|---|---|
| Software A | Real-time tracking, reporting, barcode scanning | Subscription-based, tiered pricing | Small to medium-sized businesses |
| Software B | Basic inventory tracking, order management | One-time purchase or subscription | Micro-businesses with simple inventory needs |
| Software C | Advanced features, integration with POS systems, forecasting tools | Higher subscription fees | Businesses with complex inventory and sales processes |
Implementing a New Inventory Management System
The implementation process involves data migration from existing systems (if any), comprehensive staff training on the new software, and rigorous system testing to ensure accuracy and functionality. A phased rollout can minimize disruption to daily operations.
Maintaining Data Accuracy and Integrity
Regular data reconciliation, employee training on data entry procedures, and implementation of access controls are essential for maintaining data accuracy and integrity. Implementing barcode scanning or RFID tagging can further improve accuracy.
Managing Inventory Turnover
Inventory turnover rate is a key performance indicator (KPI) that measures how efficiently a business sells its inventory. A high turnover rate generally indicates strong sales and efficient inventory management, while a low rate suggests potential problems.
Inventory Turnover Rate and its Significance
The inventory turnover rate is calculated by dividing the cost of goods sold by the average inventory value. A higher turnover rate signifies efficient inventory management and strong sales. A low rate may indicate overstocking, slow-moving items, or inaccurate demand forecasting.
Calculating and Analyzing Inventory Turnover Rate
Example: If a bakery’s cost of goods sold is $50,000 and its average inventory value is $10,000, the inventory turnover rate is 5 ($50,000 / $10,000). This indicates that the bakery sells and replaces its entire inventory five times a year. Analyzing this rate against industry benchmarks and past performance reveals areas for improvement.
Strategies for Improving Inventory Turnover

Source: medium.com
Strategies for improving inventory turnover include implementing just-in-time inventory management, offering promotions or discounts on slow-moving items, and regularly reviewing inventory levels to identify and address potential problems. Accurate demand forecasting also plays a critical role in optimizing inventory turnover.
FAQ Corner
What if my forecasting is inaccurate?
Inaccurate forecasting can lead to stockouts or overstocking. Regularly review and adjust your forecasting model based on actual sales data. Consider using more sophisticated methods as your business grows and you gather more historical data.
Successfully managing your new business’s inventory hinges on four key areas: accurate forecasting, efficient tracking, timely ordering, and robust storage. To streamline these processes and gain valuable insights, consider leveraging a dedicated +business +inventory +accounting +application. This will significantly improve your ability to optimize stock levels, minimize waste, and ultimately boost profitability. Mastering these four keys will ensure smooth operations and contribute to your business’s success.
How often should I review my inventory levels?
The frequency depends on your business and inventory type. Perishable goods require daily or weekly checks, while non-perishable items may only need monthly reviews. Establish a regular review schedule tailored to your specific needs.
What are the signs of poor inventory turnover?
Slow-moving inventory, high storage costs, and obsolete stock are all indicators of poor inventory turnover. Analyze your turnover rate regularly to identify and address these issues promptly.
Can I use spreadsheets for inventory management?
Spreadsheets can work for very small businesses, but they become cumbersome as your inventory grows. Consider dedicated inventory management software for improved efficiency and accuracy as your business scales.